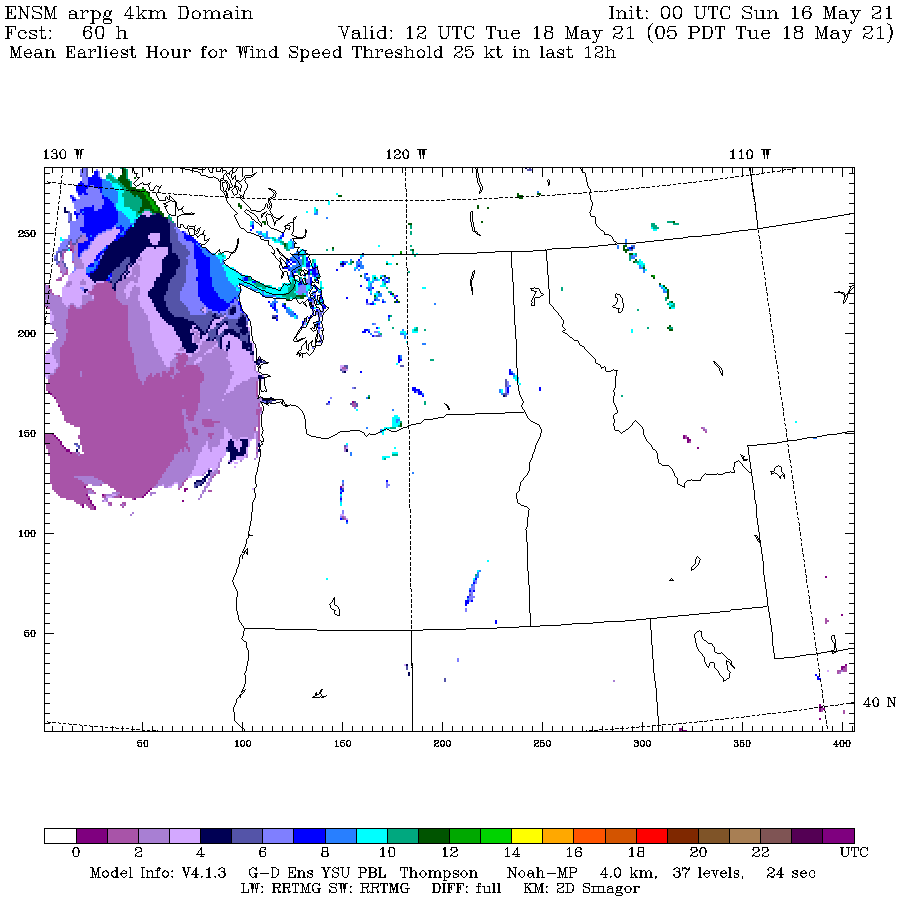
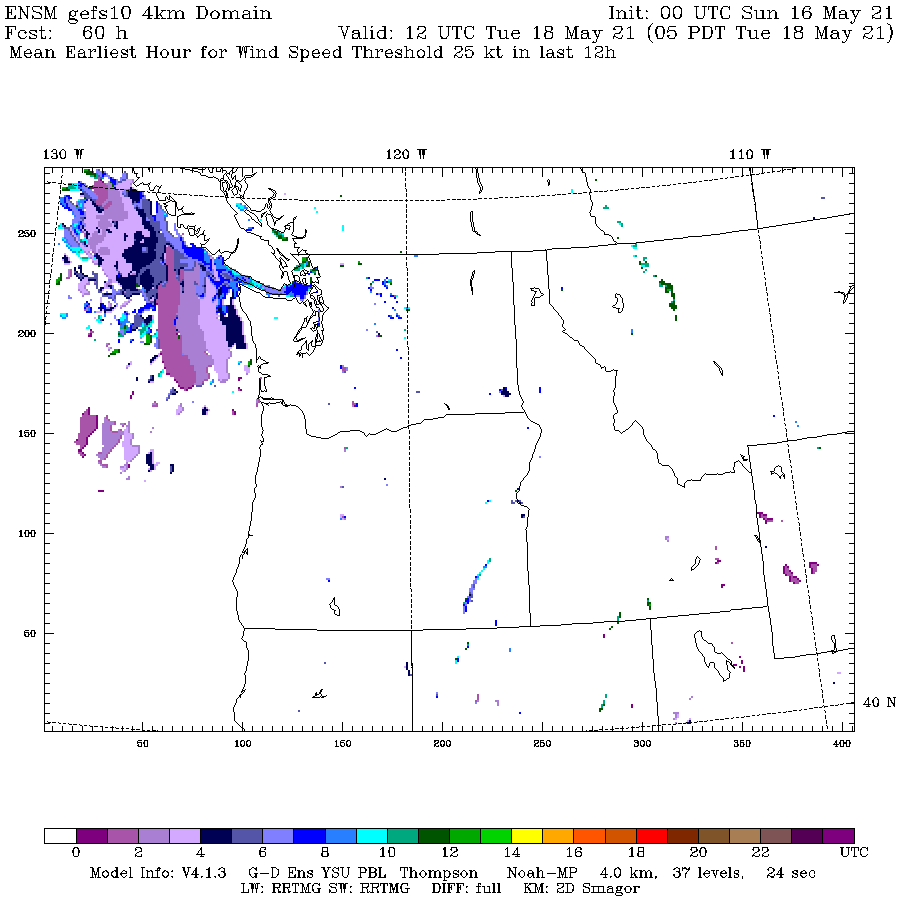
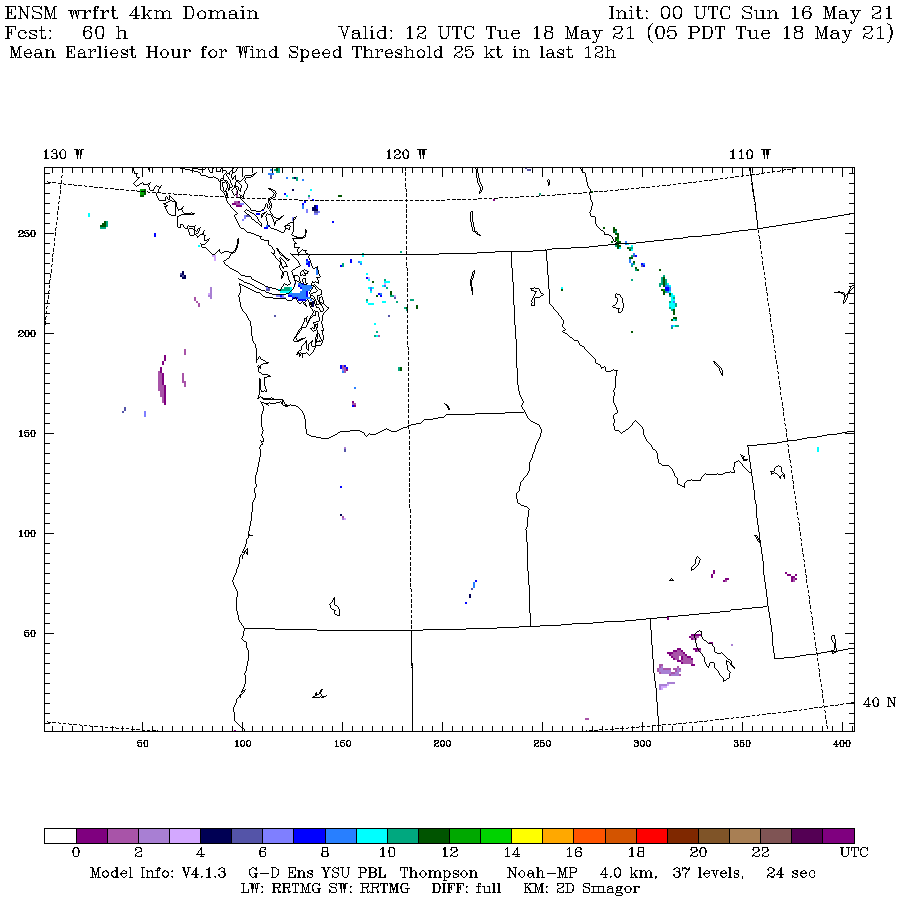
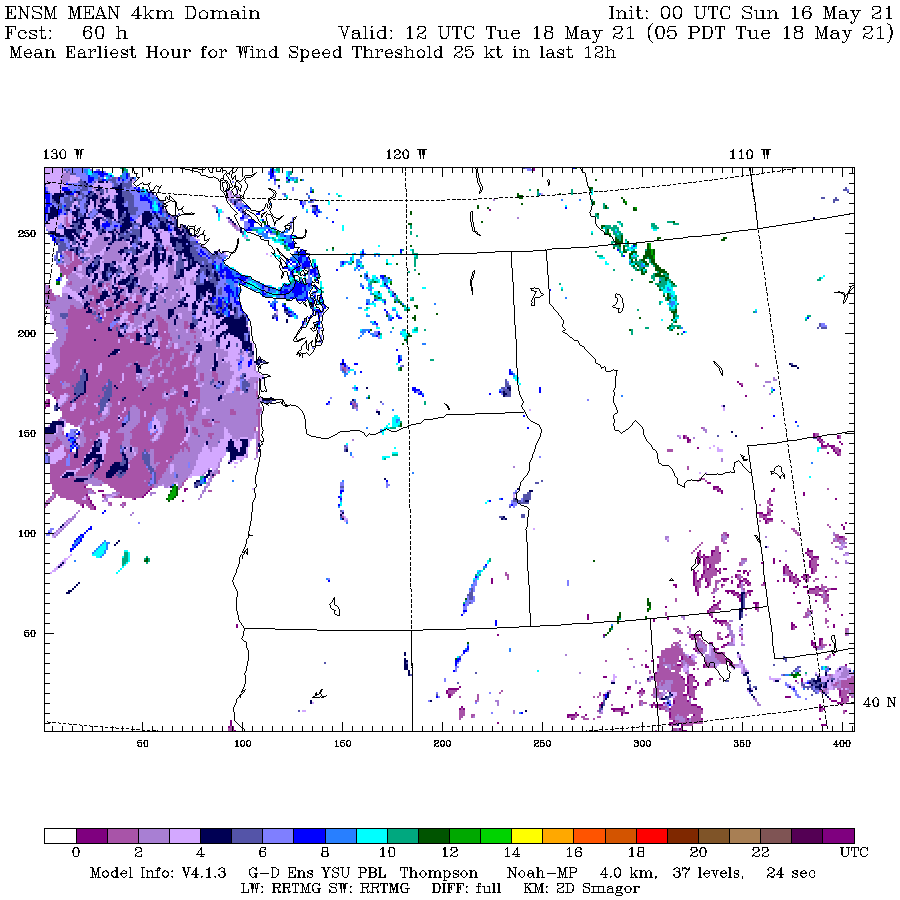
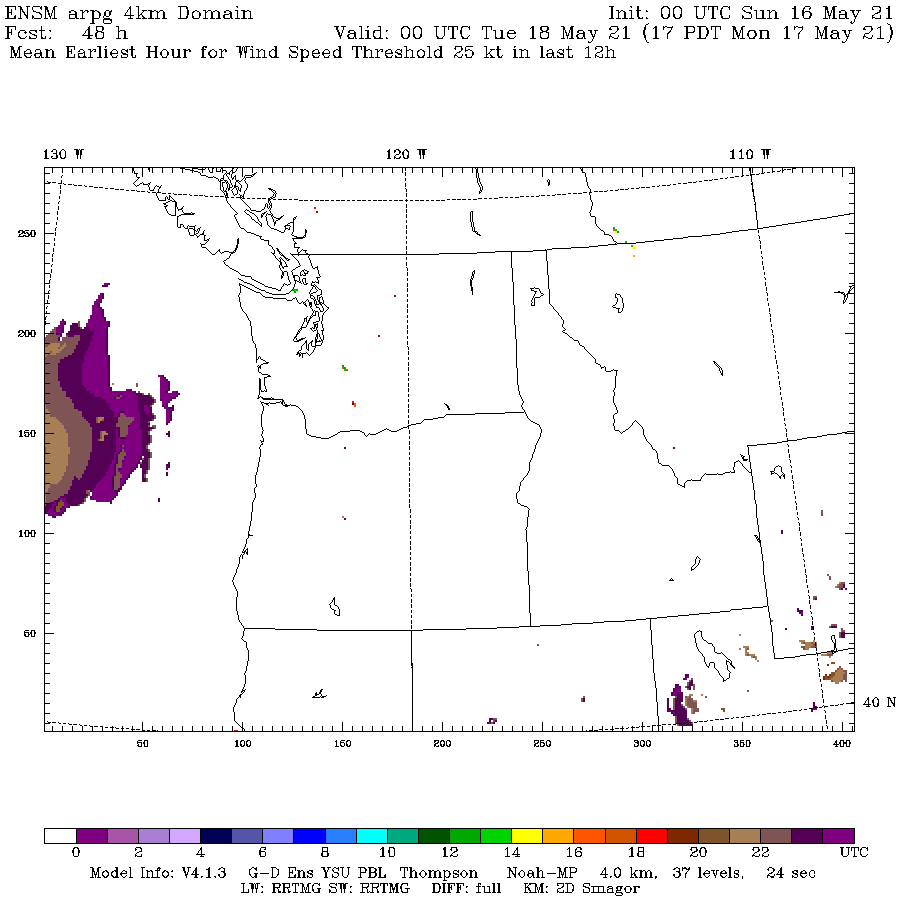
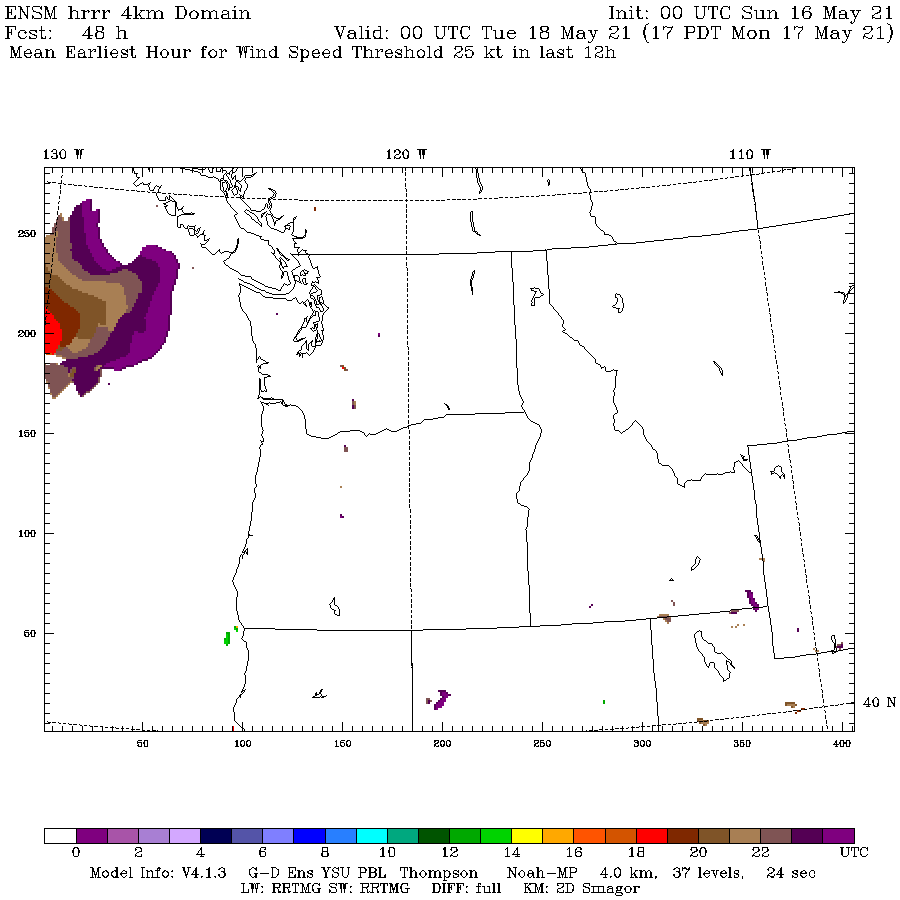
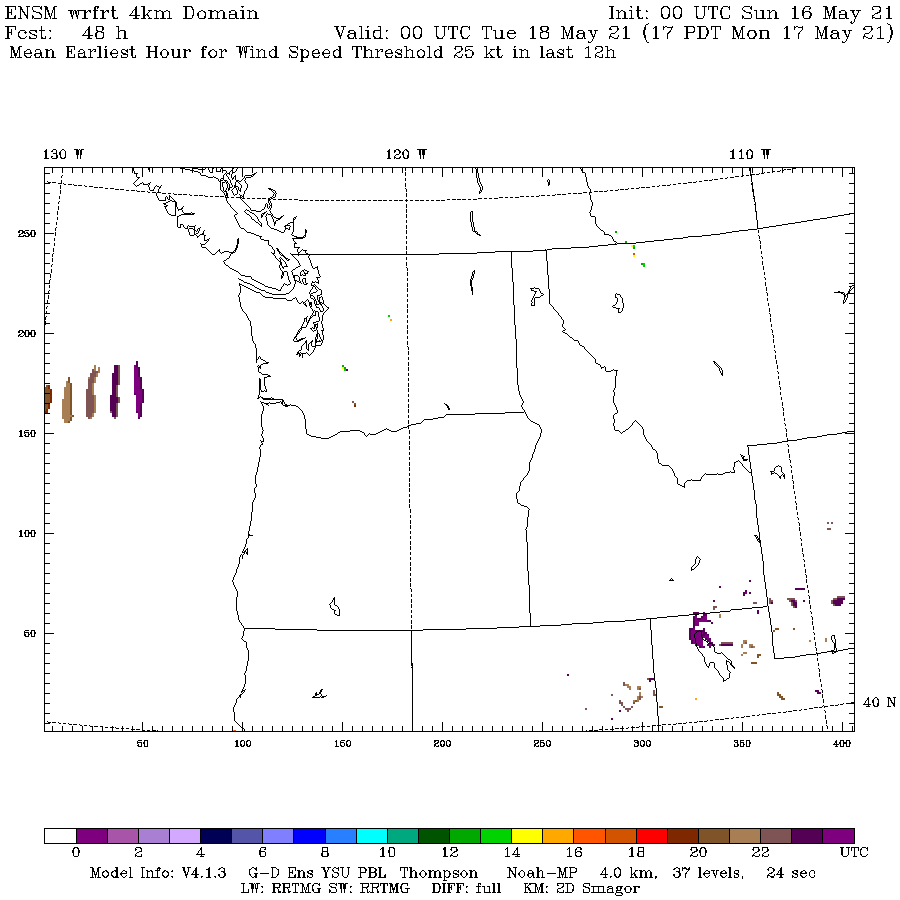
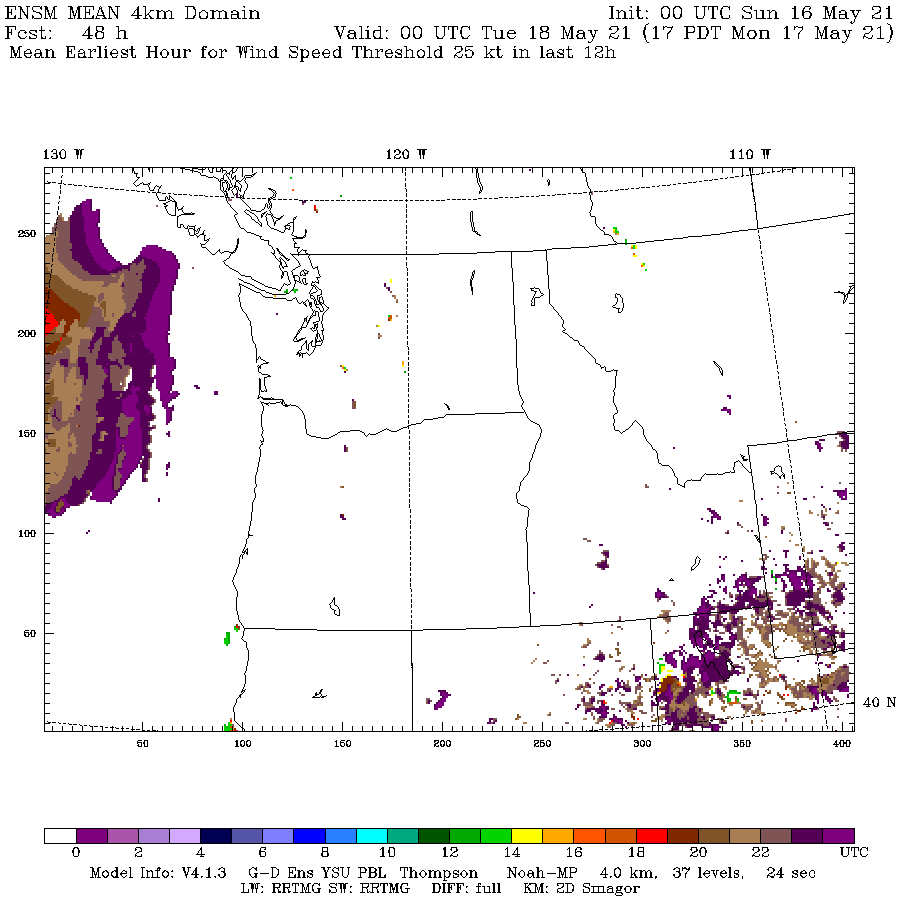
As defined in the Demuth WAF paper:
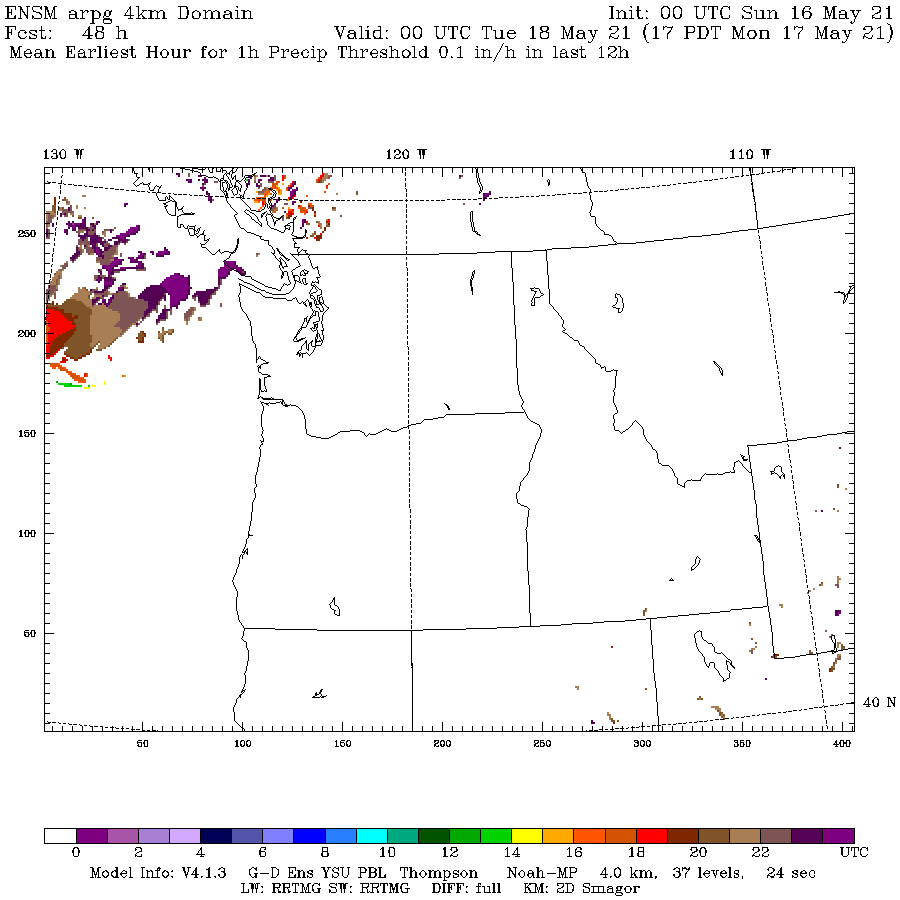
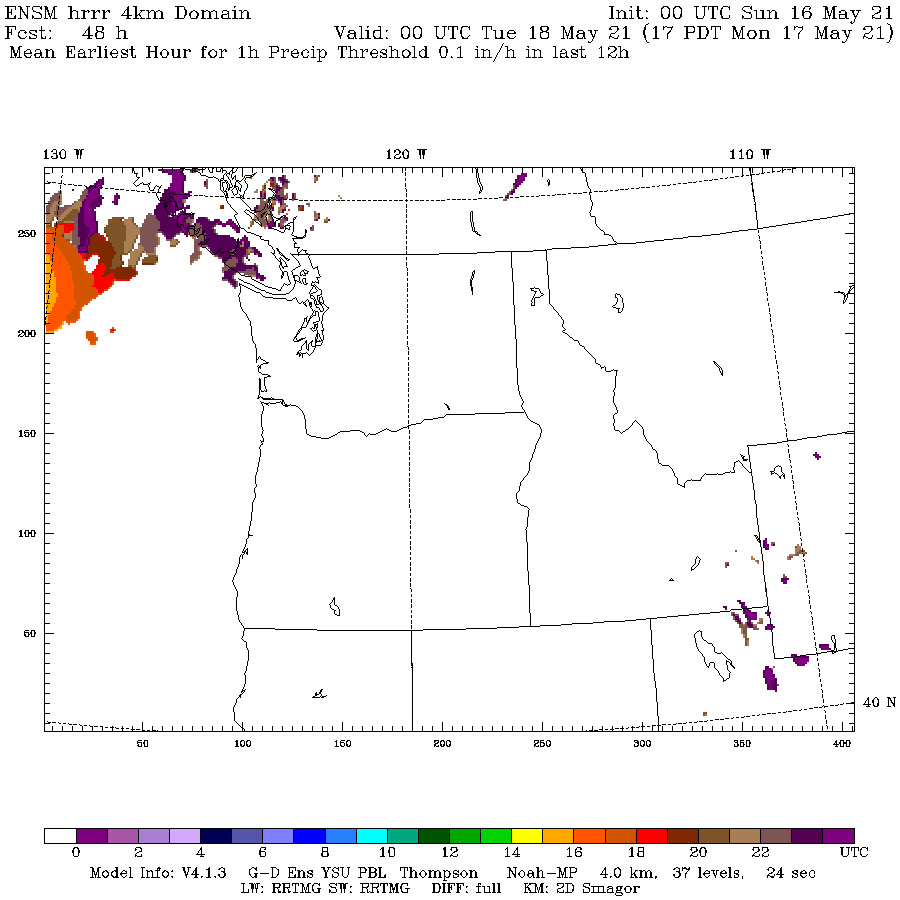
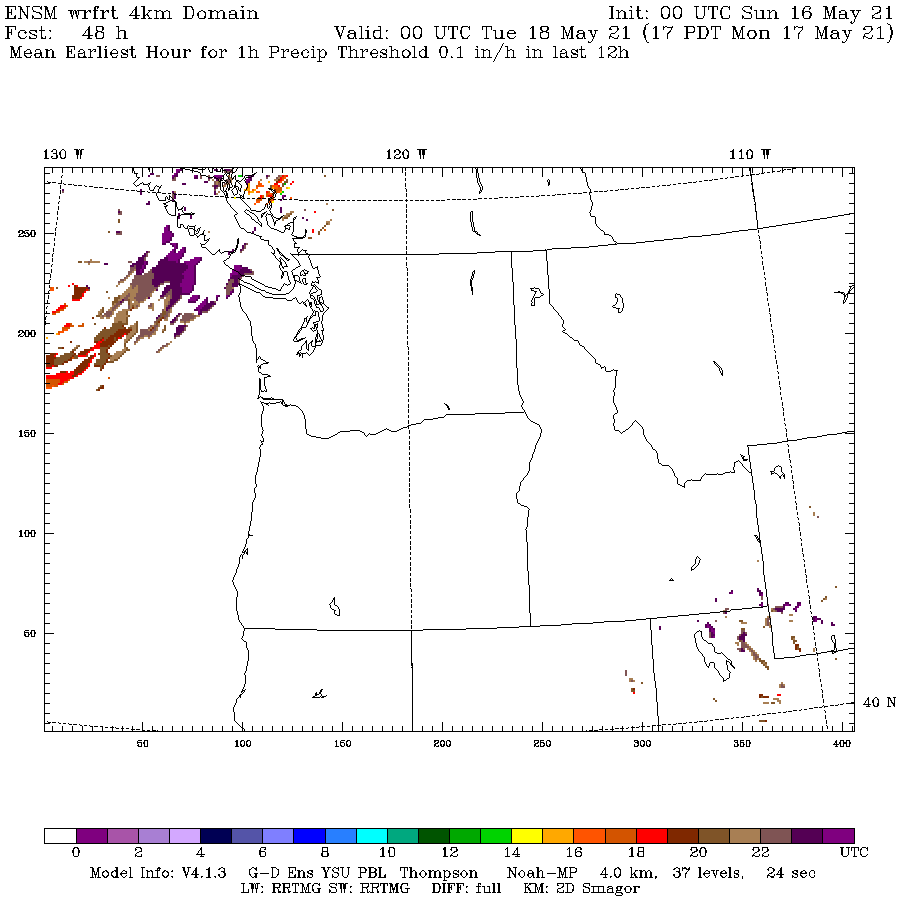
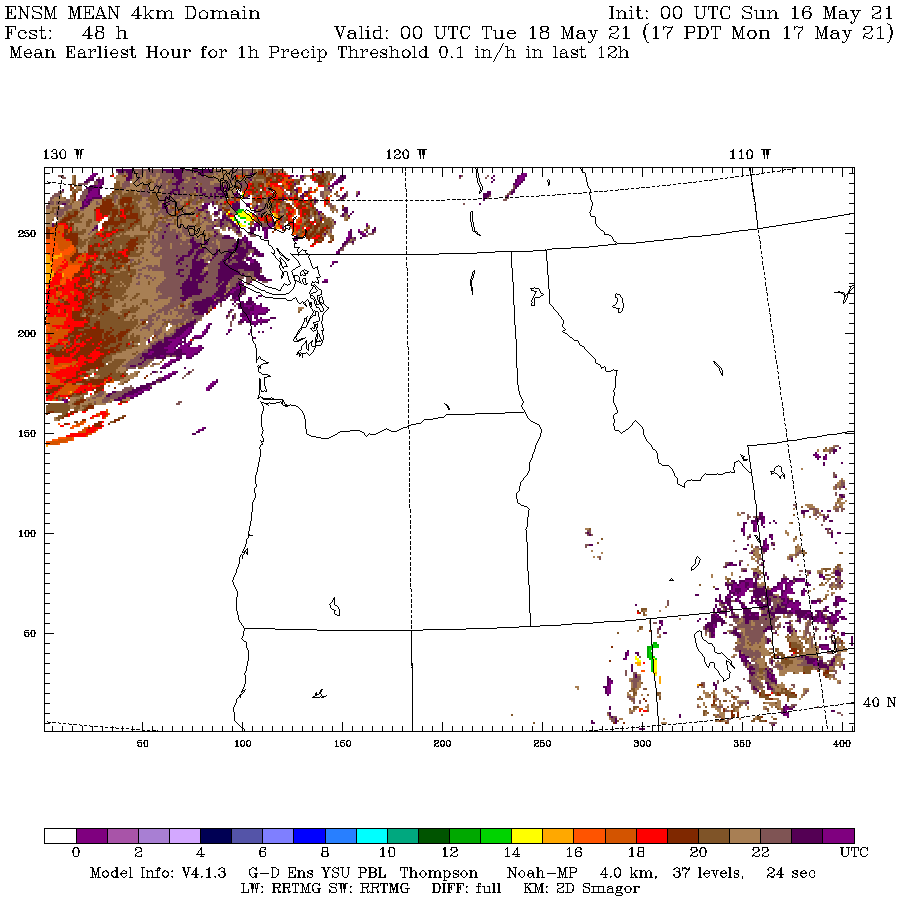
 Onset time plots:
 Values indicate the hour of the day when a threshold is first exceeded at a given point.
 Blank areas indicate points where the threshold is not exceeded in any of the
 ensemble members, at any time.  This plot is an "average" of multiple ensemble members.
 If only one member exceeds a threshold during the entire time of interest, the color is
 assigned to the first hour of exceedance in that member; if multiple members exceed the
 threshold, the color is assigned to an average of the first hours in each member.
 Duration plots:
 Values indicate the total number of hours during which a threshold is exceeded, at a
 given point.  As for the onset time plots, ensemble averaging is applied.  If only one
 member exceeds a threshold during the entire time of interest, the color is assigned to the
 duration of exceedance in that member; if multiple members exceed the threshold, the
 color is assigned to an average of the exceedance duration from each member.
These definitions lead to spreading out of features as seen in these loops:
| Member 1 | Member 2 | Sample of others | Mean | Full Loop |
|---|---|---|---|---|
|
|
|
|
full loop |
|
|
|
|
full loop |
|
|
|
|
full loop |